Decoding Hong Kong in Numbers
Comissoned by
Green Bean Media
Explainer Video
Involved in
Data Visualisation
Animation
Production Time
2 weeks
What is the project about?
What is the task?
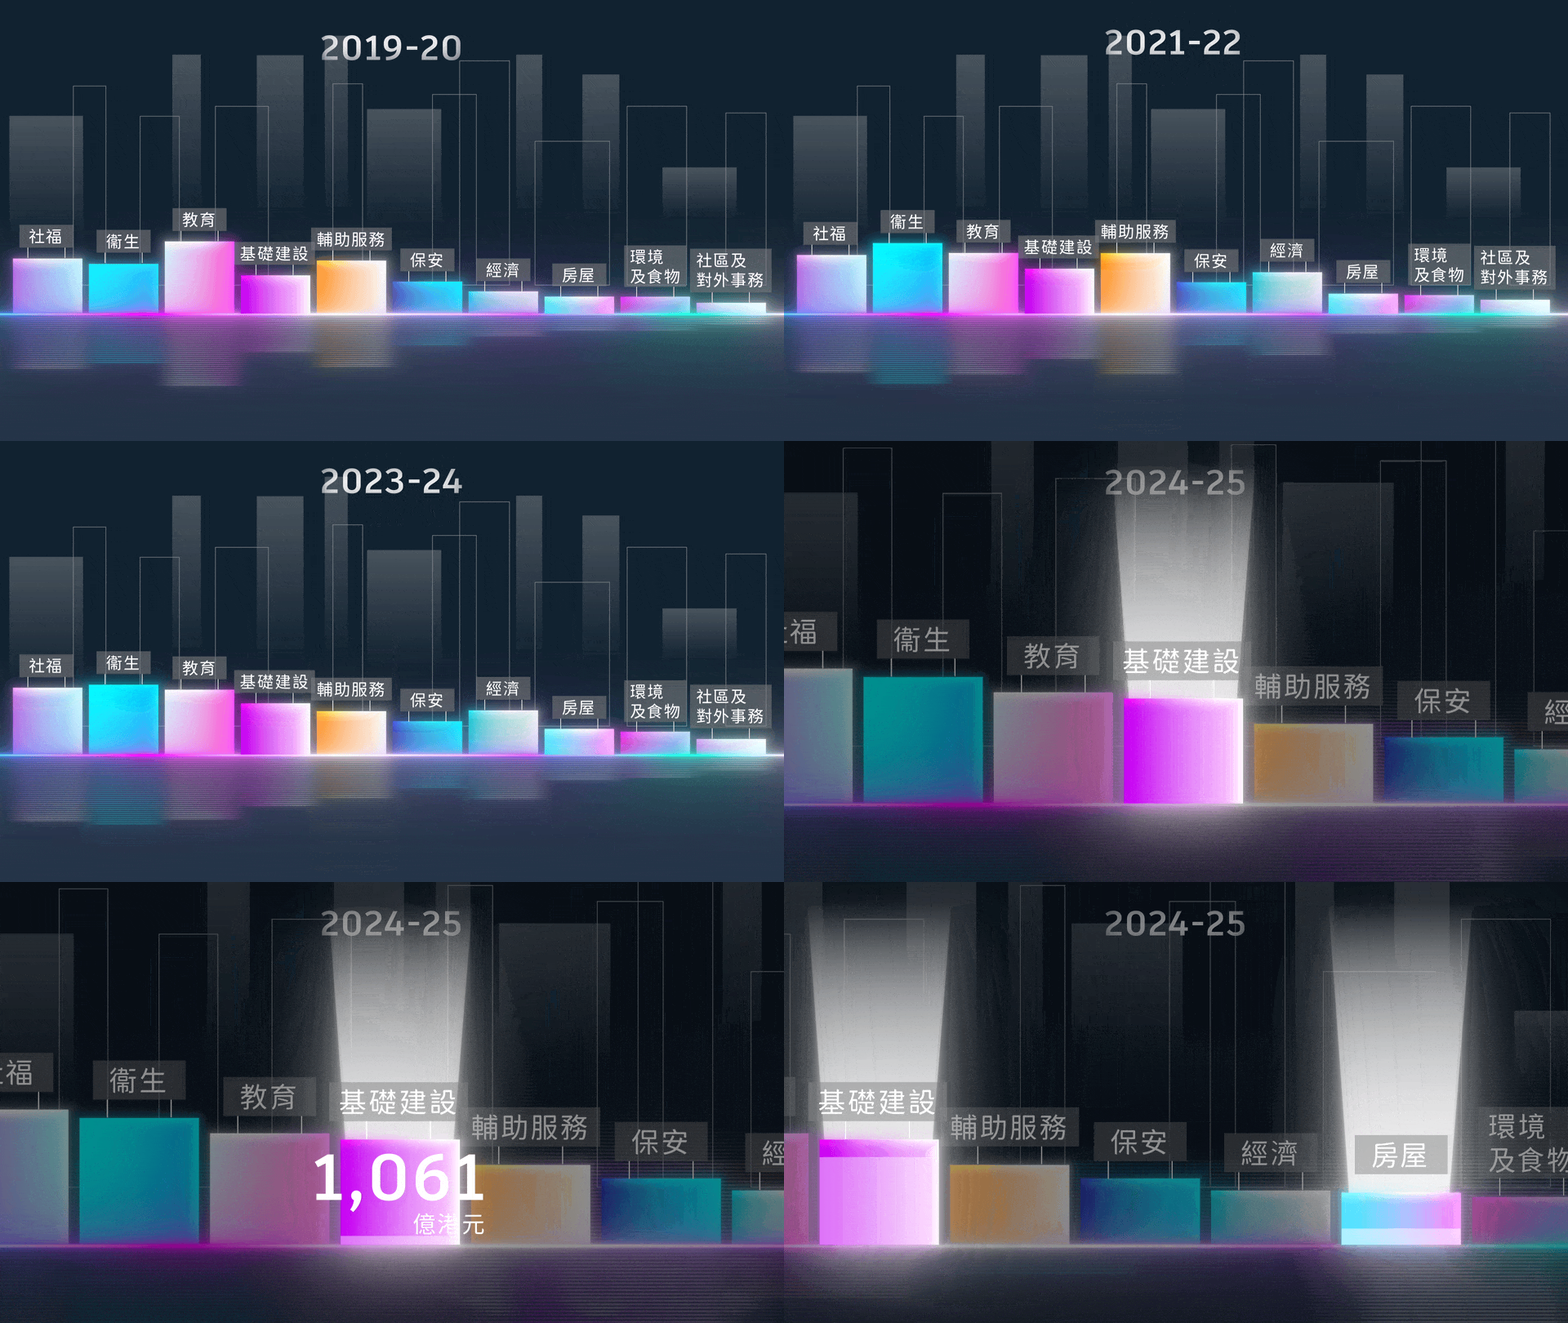
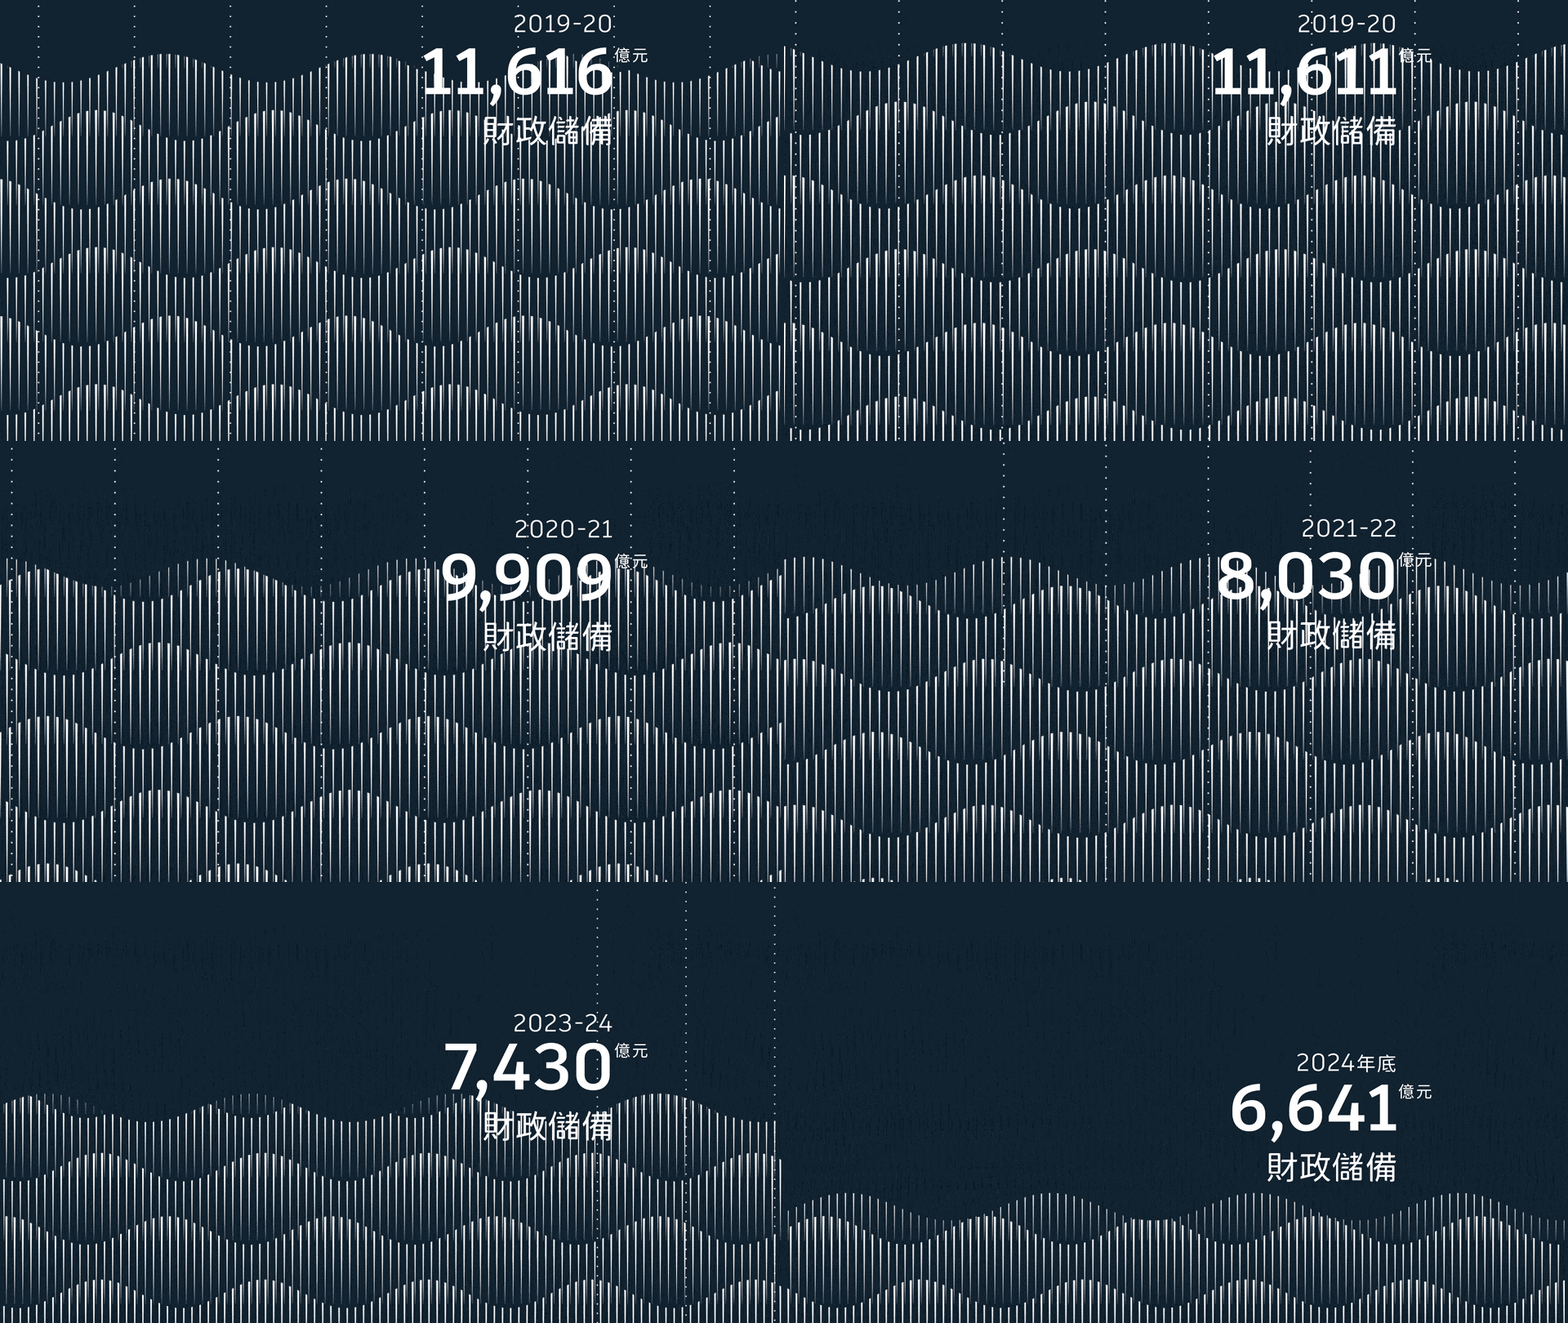
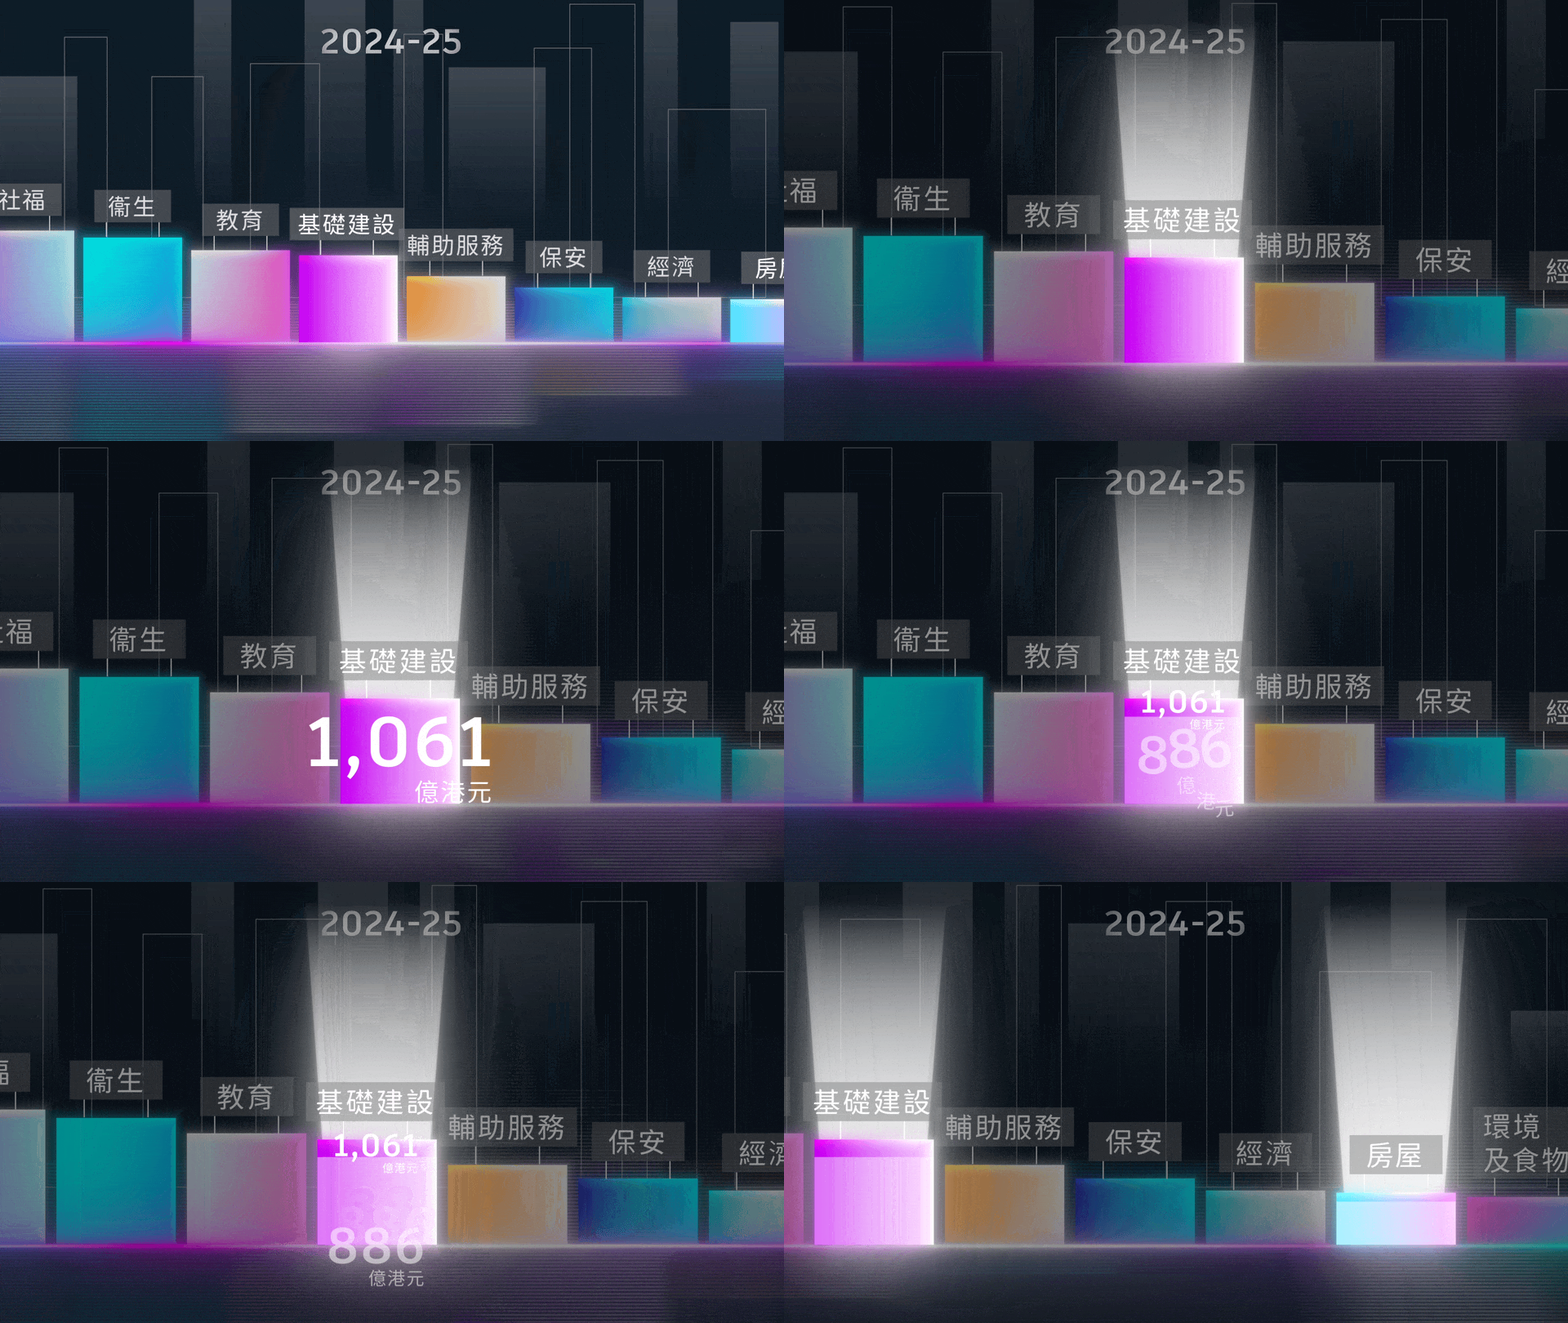
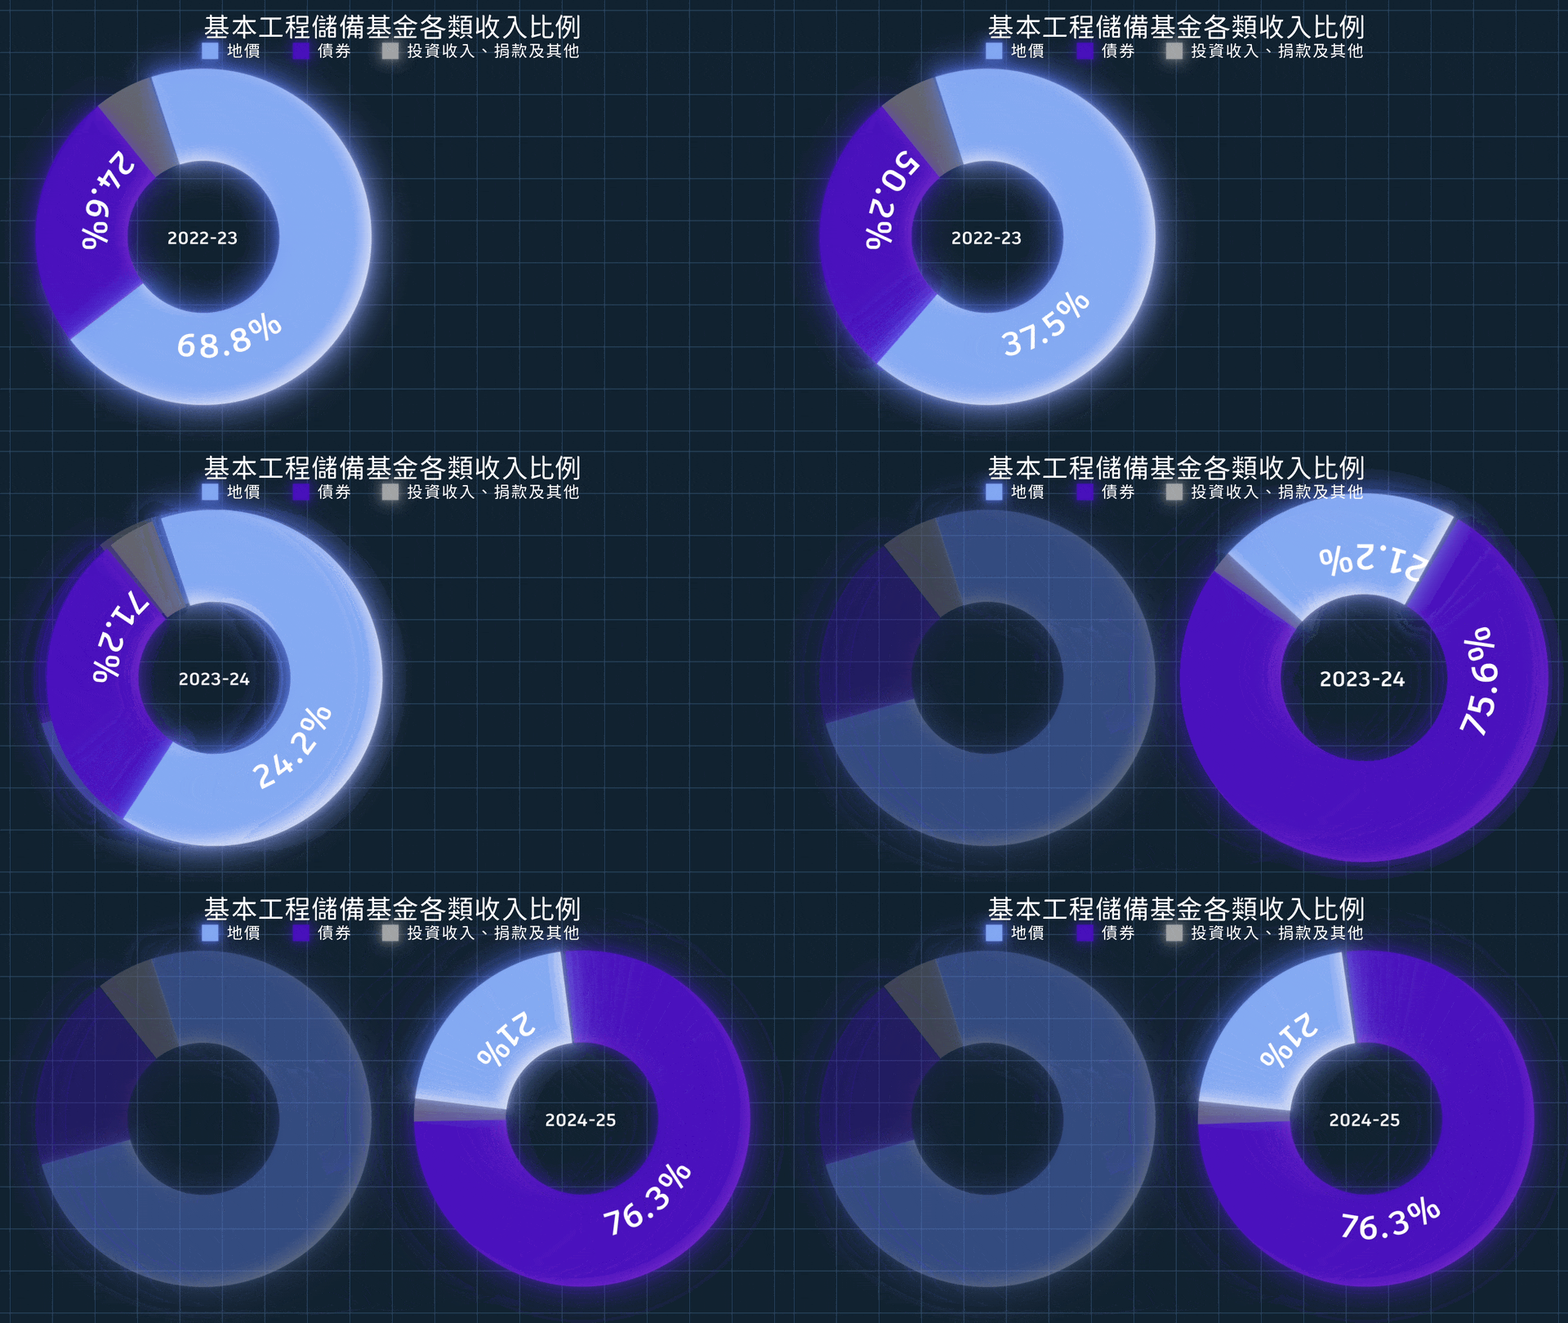
As the Hong Kong government launches its 2025 financial plan, Green Bean Media examines the data to break down budget allocation and explain the annual decline in gross savings.
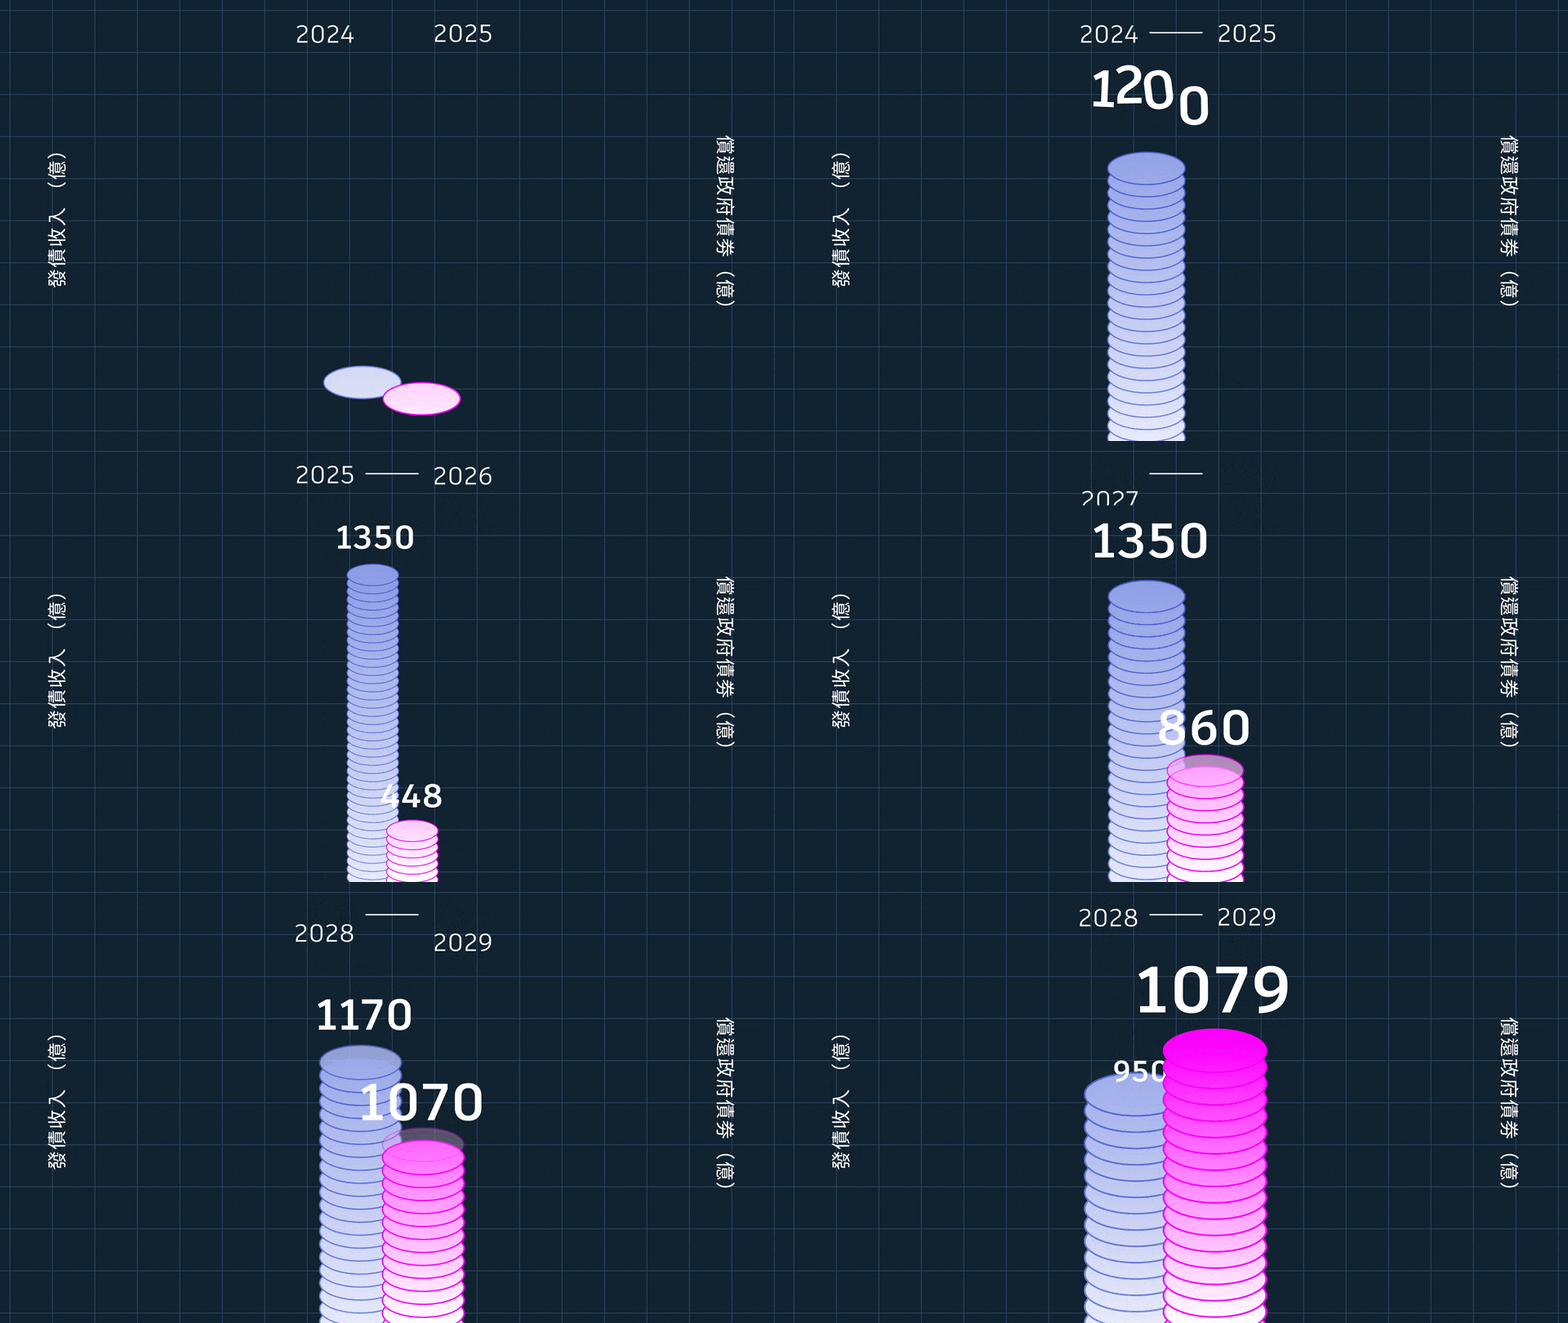
The script involves complex financial data that needs to be clearly communicated. My task was to transform dense numbers into digestible visuals, particularly when comparing multiple datasets and highlighting key differences.
How did I approach the project?
Instead of using traditional bar charts and infographics, I implemented data into visual metaphors rooted in Hong Kong's landscape. This approach made complex financial information feel both authentic and accessible to local audiences.

